152
152
Below is a peanut (Arachis hypogaea L.) tissue nutrient sufficiency table by growth stage, including macronutrients (nitrogen, phosphorus, potassium, calcium, magnesium, sulfur), micronutrients (boron, copper, iron, manganese, zinc, molybdenum), leaf water content (LWC), and Brix values. These values are based on leaf tissue analysis (typically the uppermost fully expanded leaf) and are synthesized from available agricultural research, such as studies from the University of Florida, North Carolina State University, and other peanut-growing regions, adjusted for peanut physiology.
Growth stages follow the standard peanut phenological scale:
- Vegetative (VE–V(n))
- Early Reproductive (R1–R3, flowering to pegging)
- Pod Development (R4–R6, pod fill)
- Maturity (R7–R8, pod maturation)
- Harvest
Nutrient concentrations are in percentages (%) for macronutrients and parts per million (ppm) for micronutrients, with LWC as a percentage of fresh weight and Brix (°Bx) as soluble solids in sap.
| Growth Stage |
N (%) |
P (%) |
K (%) |
Mg (%) |
Ca (%) |
S (%) |
||||||
|
Min |
Max |
Min |
Max |
Min |
Max |
Min |
Max |
Min |
Max |
Min |
Max |
|
|
VE-Vn |
4.00 |
5.00 |
0.30 |
0.60 |
2.00 |
2.50 |
0.30 |
0.60 |
0.50 |
1.50 |
0.20 |
0.40 |
|
R1-R3 |
3.50 |
4.50 |
0.30 |
0.50 |
1.80 |
2.30 |
0.30 |
0.60 |
1.00 |
2.00 |
0.20 |
0.50 |
|
R4-R6 |
3.00 |
4.00 |
0.20 |
0.40 |
1.70 |
2.20 |
0.30 |
0.70 |
1.00 |
2.50 |
0.20 |
0.40 |
|
R7-R8 |
2.50 |
3.50 |
0.20 |
0.40 |
1.50 |
2.00 |
0.30 |
0.60 |
1.00 |
2.00 |
0.20 |
0.30 |
|
Harvest |
2.00 |
3.00 |
0.20 |
0.30 |
1.00 |
2.00 |
0.20 |
0.50 |
1.00 |
2.00 |
0.15 |
0.30 |
|
B (ppm) |
Zn (ppm) |
Mn (ppm) |
Fe (ppm) |
Cu (ppm) |
Mo (ppm) |
|||||||
|
Min |
Max |
Min |
Max |
Min |
Max |
Min |
Max |
Min |
Max |
Min |
Max |
|
|
VE-Vn |
20 |
40 |
20 |
50 |
20 |
100 |
50 |
150 |
5 |
15 |
0.10 |
1.00 |
|
R1-R3 |
25 |
50 |
20 |
50 |
20 |
100 |
50 |
150 |
5 |
15 |
0.10 |
1.00 |
|
R4-R6 |
30 |
60 |
20 |
50 |
20 |
100 |
50 |
150 |
5 |
15 |
0.10 |
1.00 |
|
R7-R8 |
20 |
60 |
20 |
50 |
20 |
100 |
50 |
150 |
5 |
15 |
0.10 |
1.00 |
|
Harvest |
20 |
40 |
15 |
40 |
20 |
75 |
30 |
100 |
4 |
10 |
0.10 |
0.80 |
|
LWC |
BRIX |
|||||||||||
|
Min |
Max |
Min |
Max |
|||||||||
|
VE-Vn |
85 |
90 |
8 |
12 |
||||||||
|
R1-R3 |
80 |
88 |
10 |
15 |
||||||||
|
R4-R6 |
78 |
85 |
12 |
18 |
||||||||
|
R7-R8 |
75 |
82 |
8 |
14 |
||||||||
|
Harvest |
70 |
78 |
8 |
12 |
||||||||
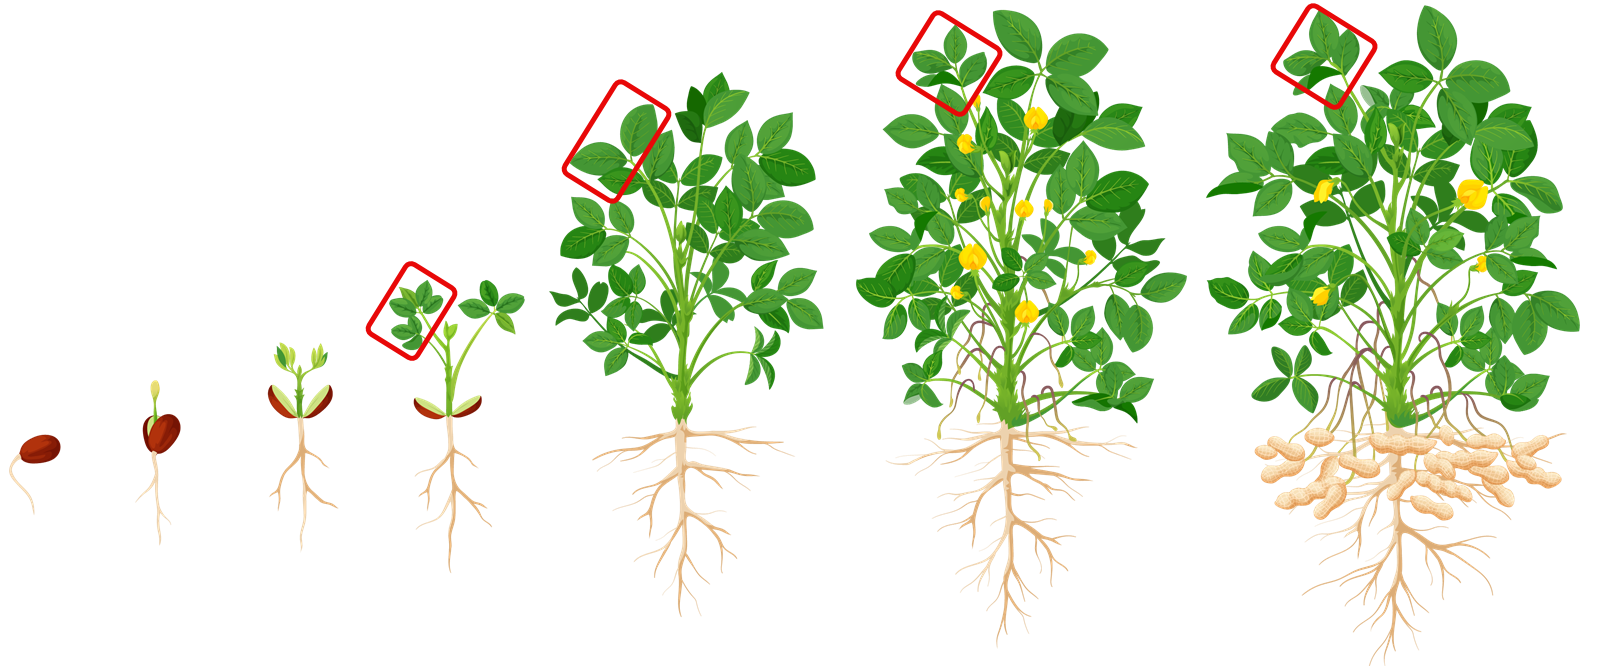
Scanning Recommendation:
- Ensure that over 25% of the scan bed is covered with a single layer of vegetation.
- Leaf selection should be similar to this illustration.