290
290
Below is a comprehensive soybean tissue nutrient sufficiency table by growth stage, including macronutrients (nitrogen, phosphorus, potassium, calcium, magnesium, sulfur), micronutrients (boron, copper, iron, manganese, zinc, molybdenum), leaf water content (LWC), and Brix values. These values are based on leaf tissue analysis (typically the uppermost fully expanded trifoliate leaf without petiole, unless specified), soybean growth physiology, and data from agricultural research (e.g., university extension services like Purdue, Iowa State, and Mississippi State).
Soybean growth stages are categorized as:
- Vegetative (VE–V(n))
- Early Reproductive (R1–R2)
- Pod Development (R3–R4)
- Seed Fill to Maturity (R5–R8)
- Harvest
Nutrient concentrations are expressed as percentages (%) for macronutrients and parts per million (ppm) for micronutrients, while LWC is a percentage of fresh weight, and Brix (°Bx) measures soluble solids in sap.
|
Growth Stage |
N (%) |
P (%) |
K (%) |
Mg (%) |
Ca (%) |
S (%) |
||||||
|
Min |
Max |
Min |
Max |
Min |
Max |
Min |
Max |
Min |
Max |
Min |
Max |
|
|
VE-Vn |
4.50 |
5.50 |
0.30 |
0.60 |
2.00 |
2.50 |
0.30 |
0.60 |
0.50 |
1.50 |
0.20 |
0.40 |
|
R1-R2 |
4.00 |
5.00 |
0.30 |
0.50 |
1.80 |
2.30 |
0.30 |
0.60 |
1.00 |
1.80 |
0.20 |
0.50 |
|
R3-R4 |
3.50 |
4.50 |
0.20 |
0.40 |
1.70 |
2.20 |
0.30 |
0.70 |
1.00 |
2.00 |
0.20 |
0.40 |
|
R5-R8 |
3.00 |
4.00 |
0.20 |
0.40 |
1.50 |
2.00 |
0.30 |
0.60 |
1.00 |
2.00 |
0.20 |
0.30 |
|
Harvest |
2.00 |
3.00 |
0.20 |
0.30 |
1.00 |
2.00 |
0.20 |
0.50 |
1.00 |
2.00 |
0.15 |
0.30 |
|
B (ppm) |
Zn (ppm) |
Mn (ppm) |
Fe (ppm) |
Cu (ppm) |
Mo (ppm) |
|||||||
|
Min |
Max |
Min |
Max |
Min |
Max |
Min |
Max |
Min |
Max |
Min |
Max |
|
|
VE-Vn |
25 |
50 |
20 |
60 |
30 |
100 |
50 |
150 |
5 |
20 |
0.10 |
1.00 |
|
R1-R2 |
30 |
60 |
20 |
60 |
30 |
100 |
50 |
150 |
5 |
20 |
0.10 |
1.00 |
|
R3-R4 |
30 |
70 |
20 |
60 |
30 |
100 |
50 |
150 |
5 |
20 |
0.10 |
1.00 |
|
R5-R8 |
25 |
50 |
20 |
60 |
30 |
100 |
50 |
150 |
5 |
20 |
0.10 |
1.00 |
|
Harvest |
20 |
40 |
15 |
40 |
20 |
75 |
30 |
100 |
4 |
10 |
0.10 |
0.80 |
|
LWC |
BRIX |
|||||||||||
|
Min |
Max |
Min |
Max |
|||||||||
|
VE-Vn |
85 |
90 |
8 |
12 |
||||||||
|
R1-R2 |
80 |
88 |
10 |
15 |
||||||||
|
R3-R4 |
78 |
85 |
12 |
18 |
||||||||
|
R5-R8 |
75 |
82 |
8 |
14 |
||||||||
|
Harvest |
70 |
78 |
8 |
12 |
||||||||
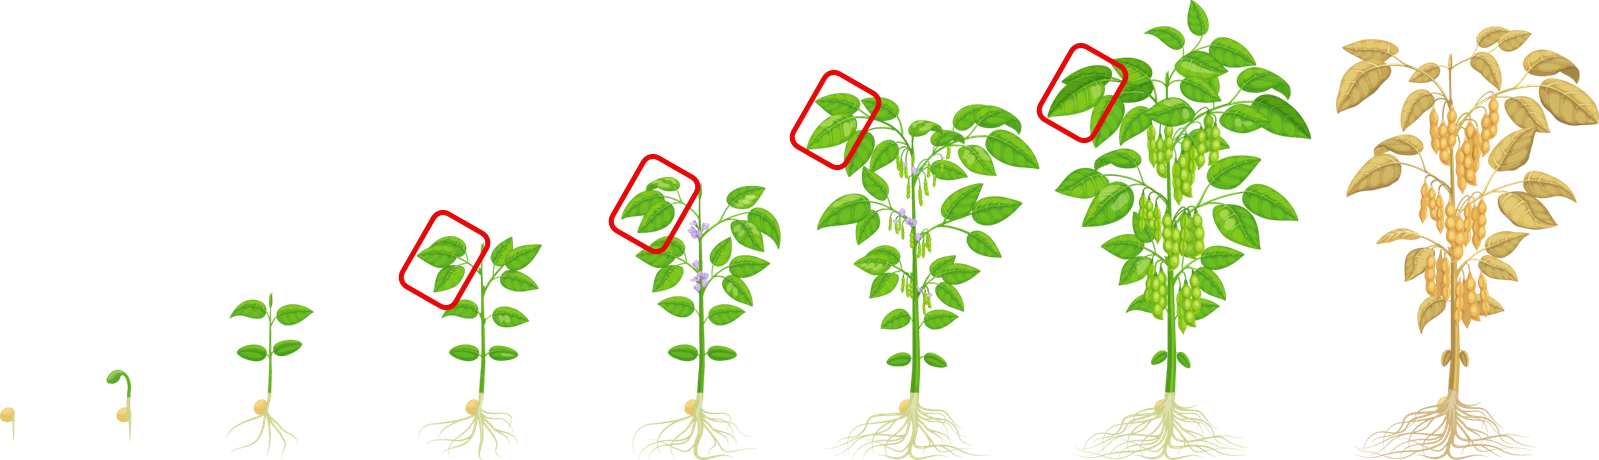
Scanning Recommendation:
- Ensure that over 25% of the scan bed is covered with a single layer of vegetation.
- Leaf selection should be similar to this illustration.