150
150
Below is a tomato (Solanum lycopersicum L.) tissue nutrient sufficiency table by growth stage, including macronutrients (nitrogen, phosphorus, potassium, calcium, magnesium, sulfur), micronutrients (boron, copper, iron, manganese, zinc, molybdenum), leaf water content (LWC), and Brix values. These values are based on leaf tissue analysis (typically the youngest fully expanded leaf, often the 4th or 5th from the growing tip) and are derived from agricultural research, such as guidelines from the University of Florida, Cornell University, and other tomato-growing regions, adjusted for tomato physiology.
Growth stages are categorized as:
- Vegetative (seedling to pre-flowering)
- Flowering (first bloom)
- Fruit Set (early fruit development)
- Fruit Ripening (maturation)
- Harvest
Nutrient concentrations are in percentages (%) for macronutrients and parts per million (ppm) for micronutrients, with LWC as a percentage of fresh weight and Brix (°Bx) as soluble solids in sap (note: fruit Brix is distinct and not included here; this is leaf sap Brix).
|
Growth Stage |
N (%) |
P (%) |
K (%) |
Mg (%) |
Ca (%) |
S (%) |
||||||
|
Min |
Max |
Min |
Max |
Min |
Max |
Min |
Max |
Min |
Max |
Min |
Max |
|
|
Vegetative |
4.00 |
5.00 |
0.30 |
0.60 |
3.00 |
4.00 |
0.40 |
0.70 |
1.50 |
2.50 |
0.30 |
0.50 |
|
Flowering |
3.50 |
4.50 |
0.30 |
0.50 |
2.50 |
3.50 |
0.40 |
0.70 |
2.00 |
3.00 |
0.20 |
0.40 |
|
Fruit Set |
3.00 |
4.00 |
0.20 |
0.40 |
2.00 |
3.00 |
0.40 |
0.70 |
2.00 |
3.50 |
0.20 |
0.40 |
|
Fruit Ripening |
2.50 |
3.50 |
0.20 |
0.40 |
1.80 |
2.50 |
0.40 |
0.70 |
2.00 |
3.50 |
0.20 |
0.40 |
|
Harvest |
2.00 |
3.00 |
0.15 |
0.30 |
1.00 |
2.00 |
0.30 |
0.60 |
1.00 |
2.00 |
0.20 |
0.40 |
|
B (ppm) |
Zn (ppm) |
Mn (ppm) |
Fe (ppm) |
Cu (ppm) |
Mo (ppm) |
|||||||
|
Min |
Max |
Min |
Max |
Min |
Max |
Min |
Max |
Min |
Max |
Min |
Max |
|
|
Vegetative |
30 |
70 |
20 |
60 |
30 |
100 |
50 |
150 |
5 |
15 |
0.10 |
1.00 |
|
Flowering |
35 |
80 |
20 |
60 |
30 |
100 |
50 |
150 |
5 |
15 |
0.10 |
1.00 |
|
Fruit Set |
35 |
80 |
20 |
60 |
30 |
100 |
50 |
150 |
5 |
15 |
0.10 |
1.00 |
|
Fruit Ripening |
30 |
70 |
20 |
60 |
30 |
100 |
50 |
150 |
5 |
15 |
0.10 |
1.00 |
|
Harvest |
20 |
40 |
15 |
50 |
20 |
75 |
30 |
120 |
4 |
10 |
0.10 |
1.00 |
|
LWC |
BRIX |
|||||||||||
|
Min |
Max |
Min |
Max |
|||||||||
|
Vegetative |
85 |
90 |
8 |
12 |
||||||||
|
Flowering |
82 |
88 |
10 |
15 |
||||||||
|
Fruit Set |
80 |
86 |
12 |
18 |
||||||||
|
Fruit Ripening |
75 |
82 |
8 |
14 |
||||||||
|
Harvest |
70 |
75 |
8 |
12 |
||||||||
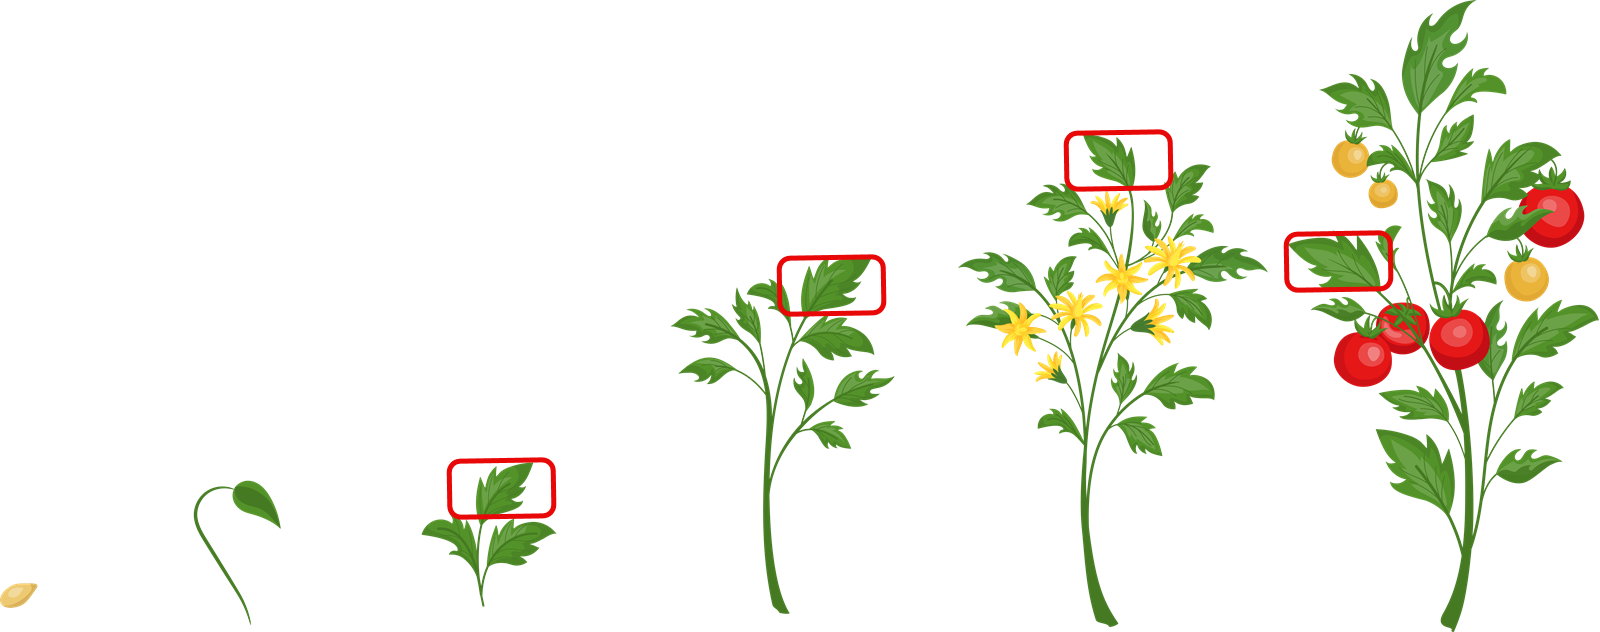
Scanning Recommendation:
- Ensure that over 25% of the scan bed is covered with a single layer of vegetation.
- Leaf selection should be similar to this illustration.