165
165
Crops in this Family: Lettuce, Sunflowers, Artichokes, Mums, Daisy, Aster, Dahlia
Below is a tissue nutrient sufficiency table for the Sunflower Family (Asteraceae), which includes crops like sunflower (Helianthus annuus), lettuce (Lactuca sativa), and artichoke (Cynara scolymus). This table provides macro- and micronutrient sufficiency ranges, leaf water content (LWC), and Brix values across key growth stages. Since nutrient needs vary across Asteraceae species, this table is a generalized synthesis based on well-studied members (e.g., sunflower data from North Dakota State University, lettuce data from the University of California, and other sources), adjusted for the family’s physiology.
Growth stages are defined as:
- Vegetative (seedling to rosette/stem elongation)
- Flowering (bloom initiation or head formation)
- Seed/Head Development (seed fill or head maturation)
- Maturation (senescence to harvest)
- Harvest
Nutrient concentrations are in percentages (%) for macronutrients and parts per million (ppm) for micronutrients, with LWC as a percentage of fresh weight and Brix (°Bx) as soluble solids in leaf sap.
|
Growth Stage |
N (%) |
P (%) |
K (%) |
Mg (%) |
Ca (%) |
S (%) |
||||||
|
Min |
Max |
Min |
Max |
Min |
Max |
Min |
Max |
Min |
Max |
Min |
Max |
|
|
Vegetative |
4.00 |
5.00 |
0.30 |
0.60 |
2.50 |
3.50 |
0.30 |
0.60 |
1.00 |
2.00 |
0.20 |
0.40 |
|
Flowering |
3.50 |
4.50 |
0.30 |
0.50 |
2.00 |
3.00 |
0.30 |
0.60 |
1.50 |
2.50 |
0.20 |
0.40 |
|
Seed/Head |
3.00 |
4.00 |
0.20 |
0.40 |
1.80 |
2.50 |
0.30 |
0.60 |
1.50 |
2.50 |
0.20 |
0.40 |
|
Maturation |
2.50 |
3.50 |
0.20 |
0.40 |
1.50 |
2.00 |
0.30 |
0.60 |
1.00 |
2.00 |
0.20 |
0.40 |
|
Harvest |
2.00 |
2.50 |
0.10 |
0.30 |
1.00 |
2.00 |
0.20 |
0.50 |
1.00 |
1.50 |
0.10 |
0.30 |
|
B (ppm) |
Zn (ppm) |
Mn (ppm) |
Fe (ppm) |
Cu (ppm) |
Mo (ppm) |
|||||||
|
Min |
Max |
Min |
Max |
Min |
Max |
Min |
Max |
Min |
Max |
Min |
Max |
|
|
Vegetative |
20 |
50 |
20 |
60 |
20 |
100 |
50 |
150 |
5 |
15 |
0.10 |
1.00 |
|
Flowering |
25 |
60 |
20 |
60 |
20 |
100 |
50 |
150 |
5 |
15 |
0.10 |
1.00 |
|
Seed/Head |
30 |
70 |
20 |
60 |
20 |
100 |
50 |
150 |
5 |
15 |
0.10 |
1.00 |
|
Maturation |
20 |
50 |
20 |
60 |
20 |
100 |
50 |
150 |
5 |
15 |
0.10 |
1.00 |
|
Harvest |
15 |
40 |
15 |
50 |
15 |
75 |
40 |
120 |
4 |
10 |
0.10 |
1.00 |
|
LWC |
BRIX |
|||||||||||
|
Min |
Max |
Min |
Max |
|||||||||
|
Vegetative |
85 |
90 |
8 |
12 |
||||||||
|
Flowering |
80 |
88 |
10 |
15 |
||||||||
|
Seed/Head |
78 |
85 |
12 |
18 |
||||||||
|
Maturation |
75 |
82 |
8 |
14 |
||||||||
|
Harvest |
70 |
75 |
8 |
12 |
||||||||
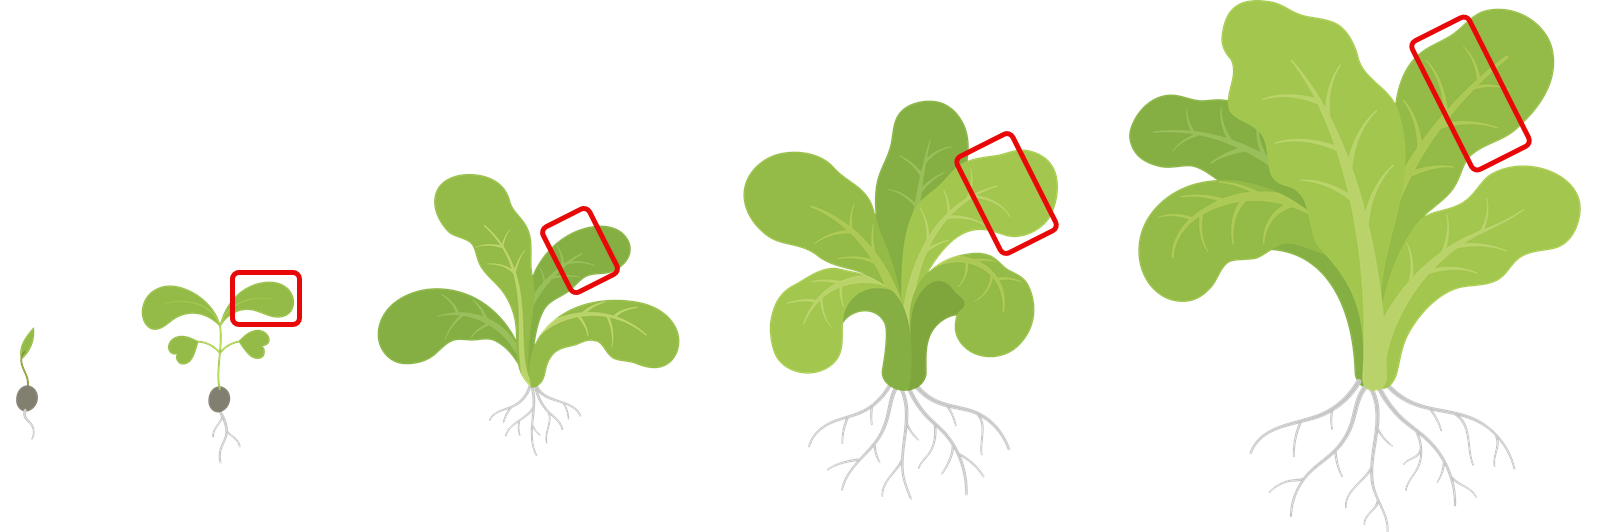
Scanning Recommendation:
- Ensure that over 25% of the scan bed is covered with a single layer of vegetation.
- Nutrient and LWC data are from the youngest fully expanded leaf (e.g., sunflower upper leaves, lettuce wrapper leaves).
- Leaf selection should be similar to this illustration.