195
195
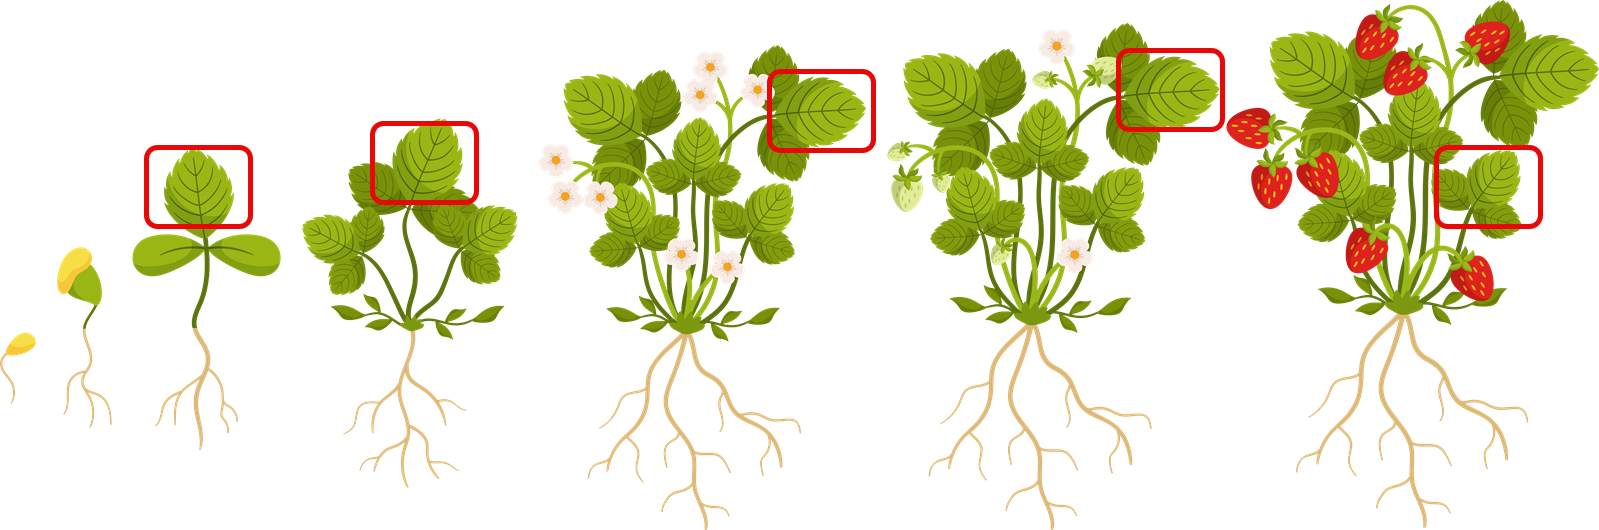
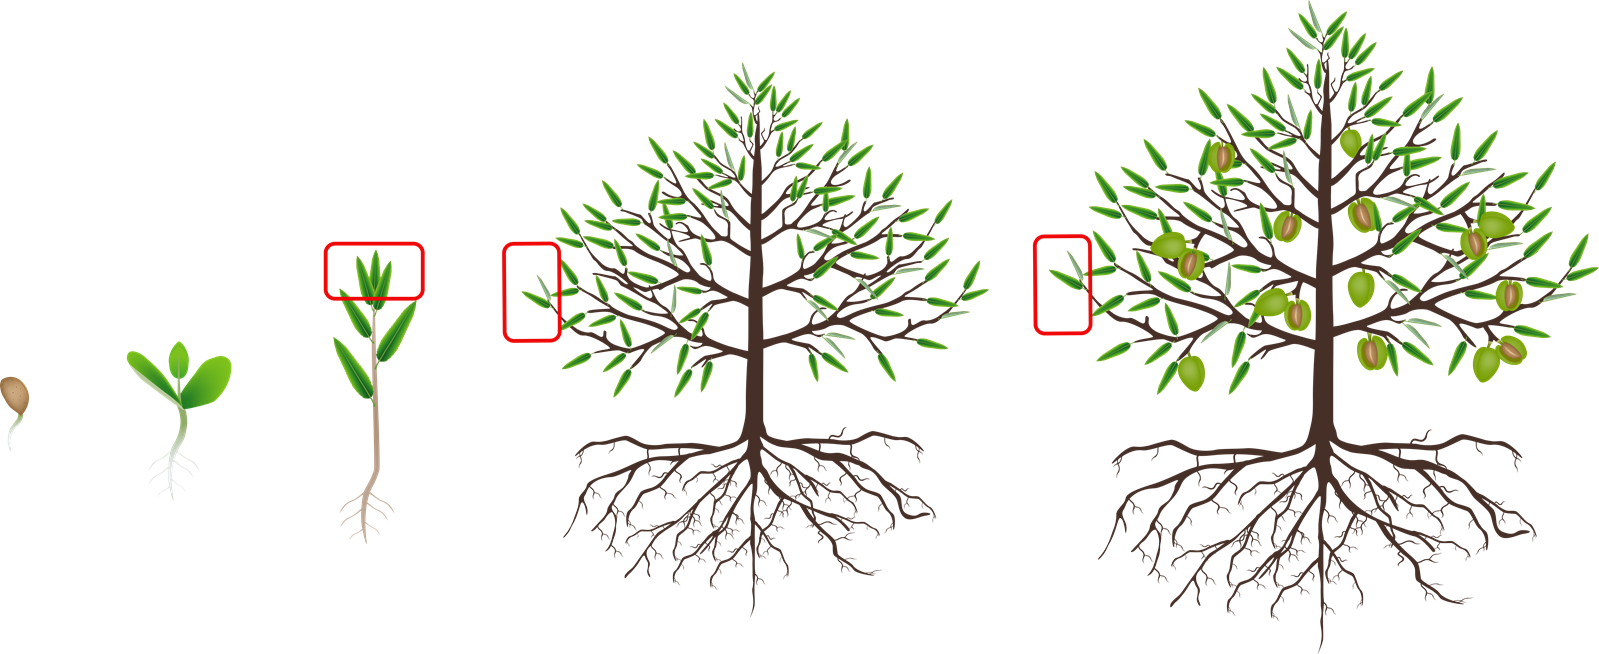
Crops in this Family: Apples, Strawberries, Almonds, Cherries, Plums, Pear, Peach, Nectarine, Apricot, Blackberry, Raspberry
Below is a tissue nutrient sufficiency table for the Rose Family (Rosaceae), which includes crops like apple (Malus domestica), strawberry (Fragaria × ananassa), and rose (Rosa spp.). This table provides macro- and micronutrient sufficiency ranges, leaf water content (LWC), and Brix values across key growth stages. Since nutrient needs vary across Rosaceae species, this table is a generalized synthesis based on well-studied members (e.g., apple data from Cornell University, strawberry data from the University of Florida, and other sources), adjusted for the family’s physiology.
Growth stages are defined as:
- Vegetative (shoot/leaf growth to pre-bloom)
- Flowering (bloom initiation)
- Fruit Set (early fruit development)
- Fruit Maturation (fruit growth to harvest)
- Harvest
Nutrient concentrations are in percentages (%) for macronutrients and parts per million (ppm) for micronutrients, with LWC as a percentage of fresh weight and Brix (°Bx) as soluble solids in leaf sap (not fruit Brix, which is a separate quality metric).
|
Growth Stage |
N (%) |
P (%) |
K (%) |
Mg (%) |
Ca (%) |
S (%) |
||||||
|
Min |
Max |
Min |
Max |
Min |
Max |
Min |
Max |
Min |
Max |
Min |
Max |
|
|
Vegetative |
2.00 |
3.00 |
0.15 |
0.30 |
1.50 |
2.50 |
0.30 |
0.50 |
1.00 |
2.00 |
0.10 |
0.30 |
|
Flowering |
1.80 |
2.80 |
0.15 |
0.30 |
1.50 |
2.50 |
0.30 |
0.50 |
1.20 |
2.00 |
0.10 |
0.30 |
|
Fruit Set |
1.80 |
2.80 |
0.12 |
0.25 |
1.80 |
2.80 |
0.30 |
0.50 |
1.20 |
2.00 |
0.10 |
0.30 |
|
Fruit Maturation |
1.50 |
2.50 |
0.12 |
0.25 |
1.50 |
2.80 |
0.30 |
0.50 |
1.00 |
2.00 |
0.10 |
0.30 |
|
Harvest |
1.50 |
2.00 |
0.10 |
0.20 |
1.00 |
2.00 |
0.20 |
0.40 |
1.00 |
1.50 |
0.10 |
0.30 |
|
B (ppm) |
Zn (ppm) |
Mn (ppm) |
Fe (ppm) |
Cu (ppm) |
Mo (ppm) |
|||||||
|
Min |
Max |
Min |
Max |
Min |
Max |
Min |
Max |
Min |
Max |
Min |
Max |
|
|
Vegetative |
15 |
50 |
15 |
50 |
25 |
100 |
50 |
150 |
5 |
15 |
0.10 |
1.00 |
|
Flowering |
50 |
60 |
15 |
50 |
25 |
100 |
50 |
150 |
5 |
15 |
0.10 |
1.00 |
|
Fruit Set |
20 |
70 |
15 |
50 |
25 |
100 |
50 |
150 |
5 |
15 |
0.10 |
1.00 |
|
Fruit Maturation |
15 |
50 |
15 |
50 |
25 |
100 |
50 |
150 |
5 |
15 |
0.10 |
1.00 |
|
Harvest |
10 |
40 |
10 |
40 |
20 |
75 |
40 |
120 |
4 |
10 |
0.10 |
1.00 |
|
LWC |
BRIX |
|||||||||||
|
Min |
Max |
Min |
Max |
|||||||||
|
Vegetative |
80 |
85 |
8 |
12 |
||||||||
|
Flowering |
78 |
83 |
10 |
14 |
||||||||
|
Fruit Set |
77 |
82 |
12 |
16 |
||||||||
|
Fruit Maturation |
77 |
80 |
8 |
12 |
||||||||
|
Harvest |
70 |
75 |
8 |
10 |
||||||||
Scanning Recommendation:
- Ensure that over 25% of the scan bed is covered with a single layer of vegetation.
- Nutrient and LWC data are from fully expanded leaves (e.g., apple mid-shoot leaves 60–90 days post-bloom, strawberry mature trifoliate leaves).
- Leaf selection should be similar to these illustrations.
Almonds:
Apples:

Strawberries: