188
188
Crops in this Family: Sugar Beets, Beets, Spinach
Below is a tissue nutrient sufficiency table for the Amaranth Family (Amaranthaceae), which includes crops like amaranth (Amaranthus spp.), quinoa (Chenopodium quinoa), and spinach (Spinacia oleracea). This table provides macro- and micronutrient sufficiency ranges, leaf water content (LWC), and Brix values across key growth stages. Since specific nutrient sufficiency data for the entire Amaranthaceae family are limited, this table is a generalized synthesis based on available data for amaranth and spinach (e.g., from University of Florida, Cornell University, and studies like those referenced in nutrient analyses of amaranth), adjusted for the family’s physiology as C3 or C4 plants with high nutrient demands for leafy growth.
Growth stages are defined as:
- Vegetative (seedling to rosette/stem elongation)
- Flowering (bloom initiation)
- Seed/Fruit Development (seed or pod formation)
- Maturation (senescence to harvest)
- Harvest
Nutrient concentrations are in percentages (%) for macronutrients and parts per million (ppm) for micronutrients, with LWC as a percentage of fresh weight and Brix (°Bx) as soluble solids in leaf sap.
| Growth Stage |
N (%) |
P (%) |
K (%) |
Mg (%) |
Ca (%) |
S (%) |
||||||
|
Min |
Max |
Min |
Max |
Min |
Max |
Min |
Max |
Min |
Max |
Min |
Max |
|
|
Vegetative |
4.00 |
5.50 |
0.30 |
0.60 |
2.50 |
3.50 |
0.30 |
0.60 |
1.00 |
2.00 |
0.20 |
0.40 |
|
Flowering |
3.50 |
4.50 |
0.30 |
0.50 |
2.00 |
3.00 |
0.30 |
0.60 |
1.20 |
2.50 |
0.20 |
0.40 |
|
Seed/Fruit Development |
3.00 |
4.00 |
0.20 |
0.40 |
1.80 |
2.50 |
0.30 |
0.60 |
1.20 |
2.50 |
0.20 |
0.40 |
|
Maturation |
2.50 |
3.50 |
0.20 |
0.40 |
1.50 |
2.00 |
0.30 |
0.60 |
1.00 |
2.00 |
0.20 |
0.40 |
|
Harvest |
2.00 |
2.00 |
0.10 |
0.20 |
1.00 |
1.50 |
0.20 |
0.50 |
1.00 |
1.50 |
0.10 |
0.30 |
|
B (ppm) |
Zn (ppm) |
Mn (ppm) |
Fe (ppm) |
Cu (ppm) |
Mo (ppm) |
|||||||
|
Min |
Max |
Min |
Max |
Min |
Max |
Min |
Max |
Min |
Max |
Min |
Max |
|
|
Vegetative |
20 |
50 |
20 |
60 |
25 |
100 |
50 |
150 |
5 |
15 |
0.10 |
1.00 |
|
Flowering |
25 |
60 |
20 |
60 |
25 |
100 |
50 |
150 |
5 |
15 |
0.10 |
1.00 |
|
Seed/Fruit Development |
30 |
70 |
20 |
60 |
25 |
100 |
50 |
150 |
5 |
15 |
0.10 |
1.00 |
|
Maturation |
20 |
50 |
20 |
60 |
25 |
100 |
50 |
150 |
5 |
15 |
0.10 |
1.00 |
|
Harvest |
10 |
40 |
10 |
40 |
20 |
75 |
40 |
120 |
4 |
10 |
0.10 |
1.00 |
|
LWC |
BRIX |
|||||||||||
|
Min |
Max |
Min |
Max |
|||||||||
|
Vegetative |
85 |
90 |
8 |
12 |
||||||||
|
Flowering |
80 |
88 |
10 |
15 |
||||||||
|
Seed/Fruit Development |
78 |
85 |
12 |
18 |
||||||||
|
Maturation |
45 |
82 |
8 |
14 |
||||||||
|
Harvest |
70 |
75 |
8 |
12 |
||||||||
Scanning Recommendation:
- Ensure that over 25% of the scan bed is covered with a single layer of vegetation.
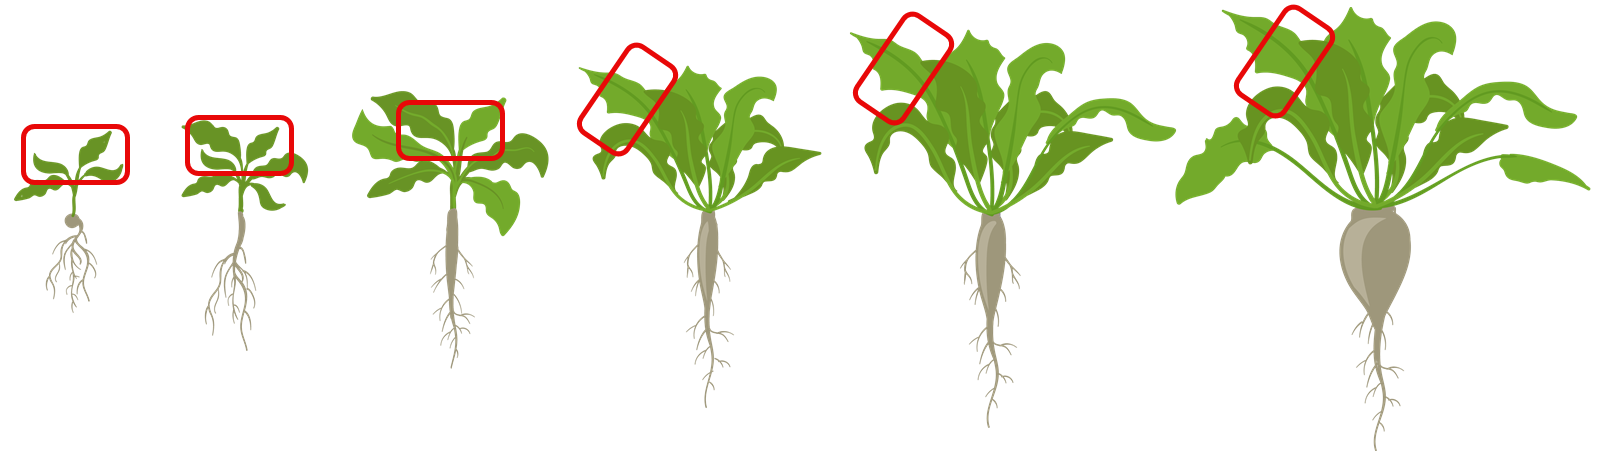
- Nutrient and LWC data are from the youngest fully expanded leaf (e.g., amaranth at 8-leaf stage, spinach outer leaves).
- Leaf selection should be similar to this illustration.