163
163
Crops in this Family: Grapes, Kiwifruit, Currants
Below is a tissue nutrient sufficiency table for the Grape Family (Vitaceae), primarily based on grapevine (Vitis vinifera and hybrids like Vitis labrusca), as it is the most agriculturally significant member of the family. This table provides macro- and micronutrient sufficiency ranges, leaf water content (LWC), and Brix values across key growth stages. The values are derived from viticulture research, such as guidelines from the University of California, Cornell University, and other grape-growing regions, adjusted for grapevine physiology.
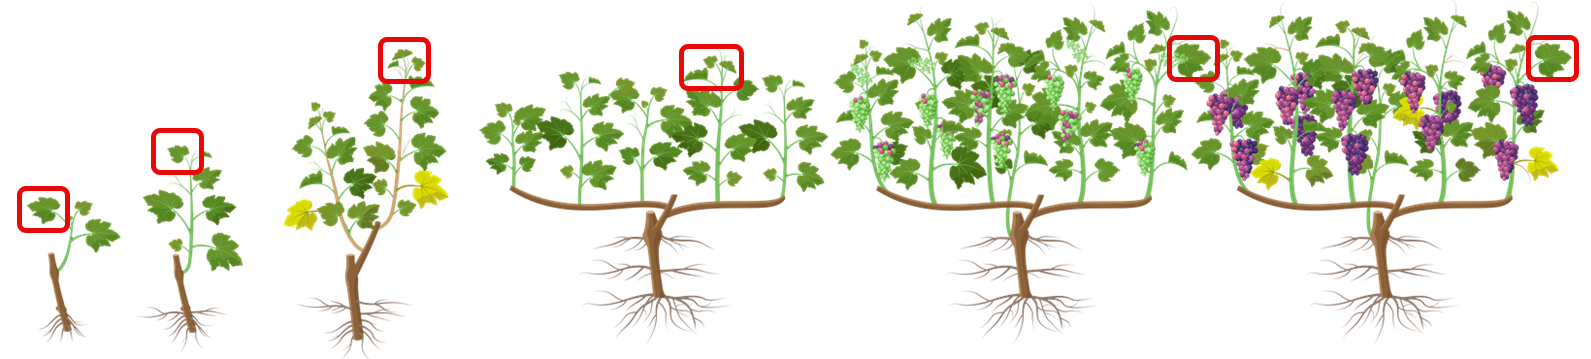
Growth stages are defined as:
- Vegetative (bud break to pre-bloom)
- Flowering (bloom)
- Fruit Set (berry formation to veraison)
- Fruit Maturation (veraison to harvest)
- Harvest
Nutrient concentrations are in percentages (%) for macronutrients and parts per million (ppm) for micronutrients, with LWC as a percentage of fresh weight and Brix (°Bx) as soluble solids in leaf sap (not fruit juice Brix, which is a separate quality metric).
| Growth Stage |
N (%) |
P (%) |
K (%) |
Mg (%) |
Ca (%) |
S (%) |
||||||
|
Min |
Max |
Min |
Max |
Min |
Max |
Min |
Max |
Min |
Max |
Min |
Max |
|
|
Vegetative |
2.50 |
3.50 |
0.15 |
0.30 |
1.50 |
2.50 |
0.30 |
0.50 |
1.00 |
2.00 |
0.10 |
0.30 |
|
Flowering |
2.20 |
3.20 |
0.15 |
0.30 |
1.50 |
2.50 |
0.30 |
0.50 |
1.20 |
2.00 |
0.10 |
0.30 |
|
Fruit Set |
2.00 |
3.00 |
0.12 |
0.25 |
1.80 |
2.80 |
0.30 |
0.50 |
1.20 |
2.00 |
0.10 |
0.30 |
|
Fruit Maturation |
1.80 |
2.80 |
0.12 |
0.25 |
1.80 |
2.80 |
0.30 |
0.50 |
1.00 |
2.00 |
0.10 |
0.30 |
|
Harvest |
1.50 |
2.00 |
0.10 |
0.20 |
1.50 |
2.00 |
0.20 |
0.50 |
1.00 |
1.50 |
0.10 |
0.30 |
|
B (ppm) |
Zn (ppm) |
Mn (ppm) |
Fe (ppm) |
Cu (ppm) |
Mo (ppm) |
|||||||
|
Min |
Max |
Min |
Max |
Min |
Max |
Min |
Max |
Min |
Max |
Min |
Max |
|
|
Vegetative |
25 |
50 |
25 |
50 |
30 |
100 |
50 |
150 |
5 |
15 |
0.10 |
1.00 |
|
Flowering |
30 |
60 |
25 |
50 |
30 |
100 |
50 |
150 |
5 |
15 |
0.10 |
1.00 |
|
Fruit Set |
30 |
70 |
25 |
50 |
30 |
100 |
50 |
150 |
5 |
15 |
0.10 |
1.00 |
|
Fruit Maturation |
25 |
50 |
25 |
50 |
30 |
100 |
50 |
150 |
5 |
15 |
0.10 |
1.00 |
|
Harvest |
20 |
40 |
20 |
40 |
20 |
75 |
40 |
120 |
4 |
10 |
0.10 |
1.00 |
|
LWC |
BRIX |
|||||||||||
|
Min |
Max |
Min |
Max |
|||||||||
|
Vegetative |
80 |
85 |
8 |
12 |
||||||||
|
Flowering |
78 |
83 |
10 |
14 |
||||||||
|
Fruit Set |
77 |
82 |
12 |
16 |
||||||||
|
Fruit Maturation |
75 |
80 |
8 |
12 |
||||||||
|
Harvest |
70 |
75 |
8 |
10 |
||||||||
Scanning Recommendation:
- Ensure that over 25% of the scan bed is covered with a single layer of vegetation.
- Nutrient and LWC data are typically from petioles or leaves opposite the basal cluster at bloom (flowering) or mid-season leaves for other stages.
- Leaf selection should be similar to this illustration.